Welcome to the Intermediate Trading Lab.
ITL - 05/26/2010
Tonight we jumped right into the members of the lab sharing some of the trades that they have been working on.
Brett shared with us that he had a LEAPS Call that he purchased on Ford (F). He purchased the Jan 2011 $7.50 LEAPS Call with a Delta of 0.90 and it filled at $4.20. We assessed whether he should transition this into a LEAPS Covered Write or not. Tonight, looking at the options, Brett could sell the $12.00 OTm Calls (current stock price is just over $11.00 and take about $0.33 credit. This produces an 8% trade for this month. Brett must decide to either keep the LEAPS and try to make more than 8% or enter into the LEAPS Covered Write.

Jane had been working on a Bull Put Spread on DLTR. She bought the $50 put for $0.15 and Sold the $55 put for $0.65. The HV was 27 and the IV was 38 with a mid point at 30. This is the correct setup in terms of volatility.

The stock was at 65 when she entered the trade. It had fallen to $59 and had an ATR of $1.00. The Delta was less than 0.20 and she was able to ride this to expiration for full credit.
David had a Bear Call Spread on BA. He Bought the 80 call for $0.28 and sold the 75 call for 0.93. The delta was less than .20 and has since dropped to 0.03! The risk is $435/contract/share and the reward is $65/contract/share. However, given the Delta, this trade has VERY high probabilities of a win. In fact, we discussed the fact that David is probably within a 90%+ profitability zone and should consider an exit.

END SESSION.
ITL - 05/19/2010
Tonight we assessed the Broad Market. The $SPX is sitting on top of the 200MA. This is the second time that it has come down to this level in about 9 days. The Fibonacci tool was used to assess the strength of the trend and in both cases the stock has reached the 61.8% level. This indicates that the upward trend may be over. We will look at the market tomorrow and look for confirmation of the change of direction (bullish). On the SPY there is a doji that formed today indicating indecision.

Brett asked the question as to how to manage trades that are close to expiration. I gave an example of a Bull Put Spread and how we have to manage the short Put overall. If the price of the stock gets "close" to the strike price, then we need to consider an exit. We discussed the Theta and it's purpose of being the decay rate of an option. Theta is positive for us when we are short and negative for us when we are long a position. The rate of decay of Theta is dangerous when we are within the one month to expiration area. We really have to manage our trades well at this point. One possible "trigger" or "alert" area is setting that alert at about 50% of the ATR above the short put. This will give us a buffer to make a decision as to what we need to do prior to expiration. Another point is if we are concerned about the trade going against us, then we need to set a 60% to 80% zone. This means that if our trade can produce 60% to 80% of our max profit, then we exit early and take the profit.

END SESSION.
ITL-05/12/2010
The market continues to recover from the near 1000 point drop on Thursday, May 6th. The $INDU and $SPX charts are showing that the Bulls continue to fight and have driven the overall broad market back to moving averages.
We looked at a new strategy tonight called the Call Ratio Backspread. This strategy is both buying and selling Call Options - however you Buy 2x the Lower Call Strikes and you Sell 1x the Higher Call Strikes. Our example was stock XYZ which was trading at $55.38. We long 2x the OTM Calls (60's) at $4.40. We Short 1x the ITM Calls (50's) at $9.60. This produces an $0.80 credit. The credit received also is our downside maximum reward. The upside maximum reward is unlimited. The maximum risk is found by taking the strike difference (60-50) and then subtracting the credit (0.80). The maximum risk on this example is $9.10/contract share.

This trade is a VERY BULLISH trade. However, if the stock reverses and drops below the 50 strike (in this example) then the credit is realized as well.
We did an example on Autodesk. We found Autodesk using the TradeSeeker.

We then looked at a Call Ratio Backspread on ADSK on the Risk Graph:

Another example was BIDU. After going through at 10:1 split, the stock is now about $79.00. Here is the risk graph on BIDU and the Call Ratio Backspread.

The CRB can be used effectively in Bullish markets and can provide some downside protection in case of a move to the Bearish side.
END SESSION.
ITL-04/28/2010
The major markets look like they have gone through a small bullish retracement. Todays candle is a Bullish Harami candle and could signal a move to the upside. The $VIX spiked yesterday, but retreated back today. The $SPX is right at support at 1180.
We discussed finding your pain point (lost money on individual trades) and having that become your maximum risk. If we size our position to our maximum risk, then with proper stop loss placement we stay away from getting even close to the pain point. We also discussed making sure that as traders we don't "over-think" or "over-analyze" our trades.
Client Virtual Trades:
Eric - Bear Call Spread on MON. Eric entered this trade on 4/13/10. The May 70/75 BCS with a short side delta of .3492. The 70 Call was $1.13 and the $75 Call was $0.30. The ATR was 1.44. Suggested stop was 50% of the ATR below the short call.

Eric - Bear Call Spread on THS. Resistance at 45.

Diana had purchased calls on CPX. She opened the trade (Oct 12.5 Calls) on 4/13/10 for $1.75 and sold today for $3.30.
Brad had purchased calls on GLD. He purchased the 110 May Calls on 4/26/10. This was a very short term trade. He has a target of 119 on the chart.

As a class we are going to look at the SPY and see what play we should do. Each member of the class will decide if they will virtual trade this or not and then be prepared to discuss next week.
Also next week we will finish our discussion on the S.U.C.C.E.S.S. Model and go into details of each of the letters and what they mean.
END SESSION.
ITL-04/21/2010
The major markets had come off of a Bullish Retracement and a Doji Candle had appeared. It was the opinion of the group to wait a further day to see if confirmation of the Doji would happen. The news outlets and other talking heads continue to cry about the Debt Default that is happening in the Middle East and other places. However, we've heard this over and over and the markets continue to present a more bullish picture. Today 4/22/10 (as of this writing), the markets started lower, but have been pushed back by the Bulls.
We added the Bollinger Bands and the RSI studies to the $SPX chart and noticed that while the SPX had touched (several times) the top side band, the RSI was at 66.34. While this shows some signs of being overbought, we cannot lose our heads. The key is to watch, make sure that confirmations happen and make logical, NON-EMOTIONAL decisions.
Eric showed us his Iron Condor on GS (Goldman Sachs). He has set this up with an overall Delta of around .21 and a $40 spread between short positions.

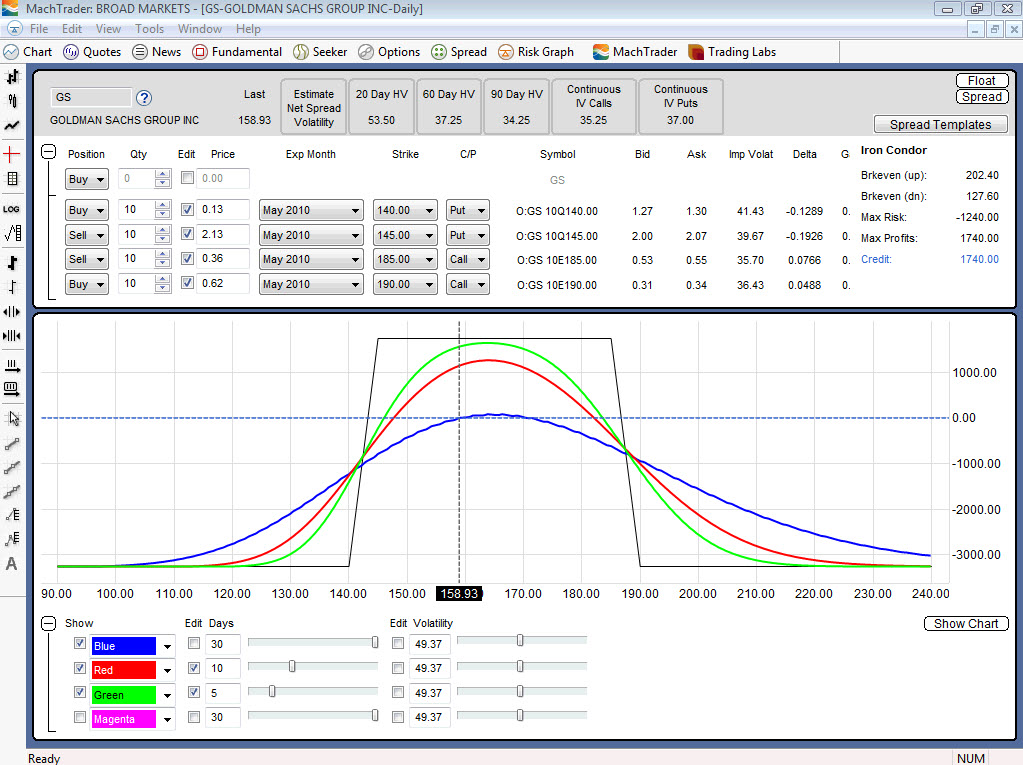
One of the key elements in this trade is the fact that it is in a very good position regarding Support and Resistance.

We finished the night by looking over the S.U.C.C.E.S.S. Model that is now being implemented by Tigrent Learning.

We used this as a basis for a Daily Routine and will go in depth on each section of the model next week.
END SESSION.
ITL-04/14/2010
The lab started tonight with a review of the VIX. The VIX ($VIX in MachTrader) is approaching the same levels as prior to the 2008 problems. Loking at both the daily and weekly charts, the VIX is very low (15.53). We also looked at the Broad Market charts ($SPX/INDU) and the markets are breaking up through key levels (DOW 11,000).
Eric had done a few virtual trades and was asked to share one. He had done an Iron Condor on POT. POT is trading between significant levels of support and resistance and so he had a fairly wide channel. The following Risk Graph depicts this trade:

We also looked at the effects of HV and IV on the trade. The "Estimate Spread Volatility" button was pressed at the top of the Risk Graph and helps to combine the Volatility of all of the positions of this trade. We also viewed the volatility in www.ivolatility.com and determined that the HV and IV were in acceptable positions for this trade (both are below the mid-point of the chart).

One of the questions that came up tonight was graphing Options. We showed the Option Chain and how one can right click the strike price and then select "Show Chart." Also, we went into the Quote Sheet on MachTrader and showed how the trader can take the Symbology information from the Option Chain and put that into the Quote Sheet and have the real time information displayed there.

END SESSION.
ITL-04/07/2010
The Lab started with Chris telling us that he had lost money today. He showed us a couple of trades that he had entered with Call Options and the market dropped today and stopped him out. SY and SINA were the two examples that we looked at.
Ashneil had purchased a LEAPS Call on EXPE on 4/6/10. Even though the market has dropped, because of the time left on the LEAPS, he is going to wait and see.
Jane has done a LEAPS Covered Write on HL. She Bought the Jan11 2.50 LEAPS Calls and Sold the May10 6.00 Calls. At the moment Jane is right at the sweet spot of the trade, if the stock remains at that price to May expiration.

Eric showed us a Bear Call Spread that he had on DMA, but was stopped out. The stock made a whippy move and triggered his stop. To re-enter the trade today would only give a credit of $0.23.

Training:
We took a look at combining the Bull Put Spread and the Bear Call Spread. This creates an Iron Condor. We want to have all four strike prices OTM and a combined Delta of less than or equal to 0.20. We used Apple as the example: AAPL and constructed an Iron Condor that had a 70 point spread with a combined Delta of 0.18.

END SESSION
Intermediate Trading Lab Notes
03/24/2010
Market Conditions:
Looked at the $SPX and $INDU. Bearish Harami candle today.
Trading Lab Client - Virtual Trades:
Jane - MNKD: LEAPS Covered Write
Bought the Jan 2011 LEAPS $2.50c at $4.90, Sold the April 2010 Call for $0.35
Eric - AXL: LEAPS Covered Write
Bought Jan 2011 $5.00c for $6.50 and Sold the April 2010 $11.00 Call for $0.55
LEAPS Covered Write
The LCW was reviewed and the example on the SPY was covered.
END SESSION.
Intermediate Trading Lab Notes
03/17/10
We started by looking at virtual trades that the members of the lab have been doing.
Diana B.
SCO - Diana waited for Pivots to appear and then on 3/12 she bought 1000 shares at $12.87 and Sold the April $14.00 Call for $0.55. A 4% gain. She checks the Stochastic and has a method of tracking the ETF's.
Jane L.
MNKD - Stock had gapped down from news that the company was not ready to send product to production. Jane had completed a Covered Call on MNKD and was managing the trade.
As a class we discussed possible scenarios to recover (from a Covered Call trade gone South). Possible solutions are: 1. Unwrap and write a new ITM CC., 2. Construct a Collar Trade (do a Covered Call and add a Protective Put, 3. A Minimal Risk Collar.
Duane G.
WDC - Western Digital. From January a downward channel and trend. MACD trending down. This is a potential short play. Support @ $37.50. Duane uses MACD, pivots, trend lines, etc.
LEAPS Covered Write:
We continued our discussion on the LCW. We looked at the SPY. Currently the SPY is trading at $117.10 and the $118 Call is at $1.26. This is a 1% trade if you do a conventional CC. We looked at the LEAPS available and found the Dec 2010 $97.00 Call. This had a Delta of .91 and was $21.60. Selling the $118 Call on this would produce a 5.8% return. The risk graph is shown:

We will discuss the Exit Strategies next week.
END SESSION.
Intermediate Trading Lab Notes
03/10/10
We looked at the broad markets and specifically the $SPX. The $SPX has hit a level of
resistance at 1150. It has also hit the upper Bollinger Band with the RSI at 68.43. Normally, if
your stock has hit the upper band and the RSI is 70 or higher, the stock has hit a peak and the
trader can expect it to retrace.

Student - Virtual Trades
Jane: FAS (Bear Call Spread)
Jane had set up a Bear Call Spread on FAS. She bought the 95 Call and sold the 93 Call. She
had set resistance below the strikes. The issue that we saw here was that the stock was in an
uptrend.

As a class we explored the possibility of doing a Bull Put Spread on FAS. This seemed like a
logical choice and we Bought the $70 Put and Sold the $75 Put. The $75 Put had a delta of -
.2090 and so our probability of the $75 Put expiring OTM is 80%. The net profit on one contract
is $92.00.

We also explored buying a Call Option on FAS. The $85 strike was selling between $12.50 and
$13.00 with a Delta of 0.6048.

We discussed Open Interest and Volume on Option Contracts. Open Interest is the cumulative
number of open contracts on a particular strike. A general rule for is that the trader should not
purchase or sell more than 10% of the Open Interest (OI) number. The Volume is the number of
open contracts for that particular trading day.
Duane talked about his play on FAS this past week which was a purchase of the underlying.
Duane uses MACD and levels of Support and Resistance to make his play. He entered in at
approximately $65.00 and the underlying has now risen to $87.67.
LEAPS Covered Write:
We started to learn about a LEAPS Covered Write. Instead of doing a regular Covered Call, the
LEAPS Covered Write can be used to provide leverage. A LEAPS is purchased as a stock
substitute and then the short-term Call is sold based upon the Stock price. We will continue our
discussion on this play next week.

END SESSION.
03/03/10 - WEDS INT. TRADING LAB
Broad Market Analysis:
$SPX in short-term uptrend. Indecision in the market the last two days. The Candles are showing a testing of resistance at 1125. Yesterday was a shooting star and today a doji (not a classic doji, but a doji regardless). The $SPY has now run up over the 50MA.
One of the most common questions from beginning traders is "where is the market going?" It's important to stop looking for the crystal ball or some other magical method to define market direction and go back to the basics. What are those? Learn how to read the charts, apply 2 or 3 technical indicators and keep it simple. We are not reading tea leaves as traders! We need to keep grounded to basic principles that are simple. Simple yes, but powerful, because these simple principles are those items that increase our probabilities of a win. If we are always searching for the holy grail then we are wasting our time and energy.
Client Virtual Trades:
Jane shared with us that she had put together a Bear Call Spread. This was on SVVS. The current price of SVVS is $15.17 and this was higher since the time of Jane putting on this trade. Jane bought the $15.00c for $0.79 and sold the $12.50c for $2.32. This trade is now ITM. Generally when we set up a credit spread trade we will set it up OTM. This gives us a 66% chance of a win based on market direction.

Risk Graph Explanation:
We discussed the Risk Graph within MachTrader. The black line is the reward and risk at expiration. The blue line that appears as default is the risk graph that day. The lines can be changed and added/subtracted and different days to expiration can be inputted. The risk graph can be compared to the stock chart by pressing the "show chart" button.
Eric showed us a Bear Call Spread that he had worked on this past week. This spread was on RRC. Eric Bought the March 2010 $60.00c for $0.50. He sold the March 2010 $55.00c for $1.65. This resulted in a net credit of $1.15. The delta was discussed on this trade. The delta, along with showing an estimation of the growth in price of the option for a $1.00 move on the stock, also shows the probability of the strike price being ITM at expiration. Since we want the strike prices to be OTM at expiration, the lower the delta (especially on the short Call) the better. Normally we like to see the delta on the short Call to be 0.20 or lower. In Eric's case the delta was 0.11 and so the probability of the short Call being OTM at expiration is 89% (1 - 0.11). This trade had (with 10 contracts) a credit of $1150.00 with $3850 of risk.

END SESSION.
02/24/2010 -
BROAD MARKETS - Looked at $SPX - small harami candle, but volume is still average at best.
Looked at the ETF SPY.
From OptionsXpress:
Trading was light in the ETF market as well, with about 1.9 million puts and 1.5 million calls traded across all the exchange-traded funds, which is about 74 percent the recent average daily. Some of the top trades of the day surfaced in the SPYders (SPY), which is an exchange-traded fund that holds all of the stocks of the S&P 500. SPY rose $1.01 to $110.82 and options trades included a May 114 - 104 put spread, which was bought at $3.96, 10000X. It's probably a bearish bet or an institution using a put spread to partially hedge a stock portfolio.
Checked Homework on Bear Call Spread:
Jane had looked at one on SOLF. It was a 7.50 - 10 BCS. She determined that this was a better Covered Call Trade than a Bear Call Spread.
Chris did a Bear Call Spread on ABX. He sold 5 contracts of the March 39C at $1.25 and Bought 5 Contracts of the March 41C at $0.62. This created a credit of $0.63. This was set up completely OTM.
Jane had an excellent Covered Call on MNKD. The stock was $9.91 and the return on selling the 10C was $1.10. This was an 11% return with 23 days left prior to expiration.
We discussed the Extrinsic Value and how, with an Option ATM, that the Extrinsic Value is at its highest amount. Homework assignment for this week was to use www.ivolatility.com and check the HV and IV for MNKD and see if the IV was above the mid-point and HV was below, which would be optimum for this trade.
END SESSION.
02/17/10 -
Reviewed the Broad Market. $SPX has turned on a pivot and is now hitting a resistance level of 1100. It has crossed the 20 MA.
BEAR CALL SPREAD:
We started from scratch on the Bear Call Spread. The following is notes from the presentation:
1.A Bear Call Spread is a Bearish Vertical Position utilizing Calls.
Vertical positions are created by using the same expiration time frame on both positions.
The Bear Call Spread is buying (longing) a higher strike Call and selling (shorting) a lower strike Call on the same month.
This can be done using both Out of the Money (OTM) Calls, or an Out of the Money (OTM) Call and an In the Money (ITM) Call.
2.The lower strike Calls have more premium than the higher strike Calls and so this is a credit trade.
Generally the credit trade requirements for a Bear Call Spread are that the risk of the transaction will be held in the account. Some brokerage firms require that the credit is also held. Check with your broker to determine the amount that will be held.
Level 4 Trading Authority
3.Trade Profile
-Trade Outlook
Bearish
-Risk
Limited (Managed)
-Reward
Limited
-Time to Option Expiration
2 Months or less
-Entry Point Trade Type
Credit
4.S.U.C.C.E.S.S. Model™-Trading Plan
1. Survey the Market
News, Broad Market, Sector and Industry Analysis
2. Use MACHTrader™
MACHTrader Searches
Bearish Retracement, Bearish Breakdown
Analyze the Trade
Individual Company News
Check for Options
Fundamentals
Technicals
3. Choose the Instrument
Buying and Selling Call Options
Expiration = 2 Months or Less
The less time the better. A credit spread is a positive Theta trade. Time is working in our favor. Same expiration date on both the Long and Short Put (Vertical Spread).
Strike Prices = Next to Each Other
Min Net Credit ≥ 10% of the spread
If this is followed, then the return on invested capital will be 11.11%, or greater, on the trade.
Short Call Delta ≤ 0.20 (80%+ Probability)
Support/Resistance
Place the OTM Bear Call Spread above resistance
4. Calculate Risk/Reward
Max Risk & Reward
Break Even
5. Execute the Trading Plan
Entry Order
Size the trade to maximum allowable loss
Option limit order contingent on stock moving down (% ATR)
Exit Order (Protective Stops)
Stop loss to a technical event
Option stop loss contingent on stock moving up1 ATR or to just below the short Call strike price.
Exit when the trade is within a 60% to 80% profit zone.
6. Supervise the Trade
Adjustment strategies
Time Frame of Trade
Day, Swing or Position
7. Systematic Journaling & Review
Update trading journal.
Example: AutoZone
Trade Overview (AZO)
1. Stock Price. . . . . . . . . . . . . . . . = $140.94
2. Buy the $150c. . . . . . . . . . . . . = $0.75
OTM,1 Contract = $75.00
3. Sell the $145c. . . . . . . . . . . . . = $1.80
OTM, 1 Contract = $180.00
4. Stock Trigger Point . . . . . . . = $140.68
Spread Entry Contingent on Stock
Stock Price - 10% ATR
ATR = $2.62
5. Initial Stop. . . . . . . . . . . . . . . . = $143.56
Option Stop Contingent on Stock
Entry + (1 ATR + 10%)
$140.68 + ($2.62 + $0.26)
Reward and Risk (AZO)
Max Reward. . . . . . . . . . . . . . . . . . . . . . . = $1.05
► Entry Point Credit
= Maximum Reward = $1.05
Max Risk. . . . . . . . . . . . . . . . . . . . . . . . . = $3.95
► Higher Strike Call = $150.00c
- Lower Strike Call = $145.00c
= Strike Difference = $5.00
- Credit Received = $1.05
= Maximum Risk = $3.95
Per Share
Reward vs. Risk Ratio (AZO)
100% Profit vs. Risk Point or
2:1 Reward vs. Risk Ratio. . . . . . . . = $142.10
► Higher Strike = $150.00c
- 2x Max Risk = $7.90
= 2:1 Reward vs. Risk = $142.10
(In this example, the 2:1 Ratio cannot be reached, as the Max Reward is obtained at $145.00)
These numbers reflect the stock price at option expiration
Break-Even Point (AZO)
The Break-Even Point is where the Stock has to be on Expiration Day for a Break-Even trade.
The Break-Even Point assumes that the trade has gone to expiration, is exercised and the position is closed.
Break-Even Point. . . . . . . . . . . . . . = $146.05
► Lower Call Strike Price = $145.00c
+ Credit Received = $1.05
= Break-Even point = $146.05
END SESSION.
02/03/10-
Overviewed New Release of MachTrader. -Option Symbology is now listed on the Option Chain.
-Notes are available now on the chart.
-Basic Pivots are now available in Mach III
Trades:
Jane L: Showed spreadsheet on Call Options. Used TradeKing searches to find Bullish Call Option trades.
Andrew S: Showed TOS and the Bull Put Spread. B Mar10 60p and S Mar10 65p.
STRADDLE:
Used Whiteboard to diagram out the Straddle and the Strangle. Pointed out 7 items to look at with a Straddle.
END SESSION.
02/10/10 -
Broad Market Analysis - Candle today points to indecision in the market. Spinning top. Candles are showing shadows that are "testing" support and/or resistance.
Diana - TBT (Inverse ETF x2)
Checks the weekly, daily and 60 minute charts. Got in and then out after seeing the candles on the 60 minute chart hit resistance.
Andrew:
CROX. Bull Call Spread. Using bouncing off the 20 MA to find the trade.
Bear Call Spread - Started looking at the Bear Call. Will continue to go over steps next week.
END SESSION
01/27/10
Google Group: OptionsMagi.
Andrew: Call on Murphy Oil and a Call and a Put on VZ. Did a Straddle on VZ.
Eric and Karen informed us that 13,000 workers were being laid off at VZ.
Discussed the Fibonacci Sequence. Reviewed Retracements and then discussed Extensions. Extensions can be used to identify Targets and also for Resistance and Support levels.
END SESSION.
01/20/10 -
Jane: Looked at JAZZ for a covered call. Bought around 9 and change and sold the 10c. Finding Trades via her TradeKing account and the option searches there.
Andrew:
Losing on some spread trades. Trading now in Naked Calls and Puts
NAKED CALLS:
Explored my hesitation for playing Naked Calls. Unlimited Risk. Showed the AAPL 220 Naked Call. Delta at .38. Showed the AAPL 240 Call, Delta at .13. Regardless of the delta or price, the MAX RISK is still UNLIMITED.
NAKED PUTS:
Risk on a Naked Put is LIMITED. It can still be huge dollar wise, but it eventually caps out.
FIBONACCI SEQUENCE:
Looked at the Fib Sequence (Part I). Studied the Retracement. Will review and then study the Extension next week.
END SESSION.
01/13/10 -
MARKET OVERVIEW:
FLAT TO BULLISH ON $SPX
CLIENT TRADES:
JOSHUA: INTC CALENDAR SPREAD.
B 12 FEB10 $21C
S 12 JAN10 $21C
Small window to be profitable. Have to maintain the trade.
JANE: COV CALL ON LCC
DISCUSSION ON OTM VS ITM. ITM CAN BE LESS PROFITABLE, BUT CAN PROVIDE DOWNSIDE INSURANCE.
INFORMATION FROM THE OPTIONS CLEARING CORPORATION ON PUT/CALL RATIOS.
Q: What is a put/call ratio and how is it used?
A: The put-call ratio is simply the number of puts traded divided by the number of calls traded. It can be computed daily, weekly, or over any time period. It can be computed for stock options, index options, or future options. Some market technicians suspect that a high volume of puts relative to calls indicates investors are bearish, whereas a high ratio of calls to puts shows bullishness.
Many market technicians find the put-call ratio to be a good contrary indicator, meaning when the ratio is high, market bottom is near, and when the ratio is low, a market top is imminent. The more highly traded options contracts produce a more reliable put-call ratio. Traders and investors generally buy more calls than puts where stock options are concerned. Therefore, the equity put-call ratio is a number far less than 1.00. If call buying is heavy, the equity put-call ratio may dip into the .30 range on a daily basis. Very bearish days may occasionally produce numbers of 1.00 or higher. An average day will produce a ratio of around .50 - .70.
Once again, the numbers are interpretive numbers. Here are some numbers that may be used for illustrative purposes:
Index P/C Ratio
* Bullish: 1.5 or higher
* Bearish: .75 or lower
* Neutral: .75-1.5
Equity P/C Ratio
* Bullish: .75-1
* Bearish: .4 or lower
* Neutral: .4-.6
END SESSION
01/06/10 -
Session tonight was focused around individual trades of the group.
Kevin was frustrated because of many of his trades being stopped out. We opened it up to general ideas.
* Tightening up stops instead of using ATR + 10%. Use just the ATR to start out. See if that might help.
* Stick to your rules. Make minor changes to the rules if you need too and not really extensive ones.
* Take a break if you need too from trading. Everyone needs time to regenerate.
Jane shared her desktop and using Trade King. She is primarily concentrating on Covered Call strategies and uses a screener within TradeKing. she also has devised her own spreadsheet to track her trades.
Duane had us look at the stock BKE. He trades mostly stocks and had decided to enter this trade at the first of December after confirming using the Fibonacci tools.
We looked at the basic Fib tools within EduTrader.
Joshua showed us his account in ThinkorSwim. He talked about having bought a Call with about 13 month left to expiration. He also talked a little about finding information about institutional trading at www.mffais.com. Put a /C, where "C" is the ticker of the stock.
Talked about the new GoogleGroup that Mitch will be putting together "OptionsMagi." If you want to be part of this trading group, please send me an email and I will send you an invitation --- optionsmagi@gmail.com
END SESSION.
12/30/09 -
? What are you doing in terms of trades.
? Are you managing your trades to keep you sane?
VIRTUAL
Jane: Covered Call on MSO. Uses TradeKing to generate list of options to have as candidates.
MSO - flat. Sold ATM MSOBA for $0.45 - Feb
Kevin: Naked Put on WLP
Sold the Jun 2010 $55p for $3.90. Discussed the trade in terms of length.
?Why do we sell Naked Puts short-term?
Because of the Theta. We want Theta to work in our favor. If you sell an Option, Theta is positive, meaning that it is positive for you and the trade. If you sell high and have to buy back low, then you want the "buy back" as low as you can, and a high Theta helps with that. In this trade, the Theta is only $0.01/share/day. If you had a shorter term put, then you would see the Theta increasing.
$VIX.
Discussed the lower barriers of 20-25 and the upper barriers of 45-50. Also discussed how in Sept/Oct/Nov of 2008 as the market was "melting" down, that the VIX hit 89+.
END SESSION
Discussion Notes
w/ Tim Justice
12/23/09
Trade Reviews
~ Andrew ~ As I looked at Andy's account a few things popped up for conversation. 1st, when trading vertical spreads you want to set targets so that the broker will take you out at some point. It's easy to sit in these trades too long and a target order will help prevent that. 2nd, I saw some good trades, but I'd like to see more of them. Most traders should have 10 or more trades going at all times. You need to keep them small, balance them from strategy to strategy and also in terms of direction. It's not better to have just a few trades that you watch like a hawk. It is better to spread your risk out, spread your money out and get into lots of positions.
My Random Thoughts
~ As I talked to the group a few things came up:
1. Your goal as a trader should be to perfect a few models (strategies) rather than try to learn everything. Some great traders simply focus on 2 or 4 models rather than 10 to 15. There are lots of strategies out there and it can't hurt to learn them but in your actual trading its better to try and perfect the few you like best.
2. With credit spreads your goal is not necessarily to let them expire. Expiration is one target you could use. But I personally rarely target expiation. Most of my option trades (including credit spreads) I enter with several months of expiration time remaining and exit with at least a month to go until we hit that final day. This choice would be decided from trader to trader and its more important that you can answer the question: why would a trader chose to target expiration and why would a trader chose to get out months before?
3. To effectively manage option trades you MUST have an advanced understanding of delta and how it measures your risk. For example in our bull put spread conversation I showed a risk graph and explained that those trades should be exited if the delta on the short leg of the trade ever hit .50 per contract. Delta can range from 0 to 100. 50 should be near or at the money and the losses on bull put spreads happen when stock prices go into the money of your spread. By creating a rule that says "I will get out if the delta of my sold put hits 50" you are essentially managing your risk and developing a strict consistent guideline for your trading strategy. This type of thing needs to be done with each and every one of your strategies.
END SESSION
12/16/09 -
MARKET CONDITIONS
Flat - Sideways
Michael - CLF -
Duane - CLF
Eric - INTC
Whiteboarded the Straddle. Buying Calls and Puts on the same Strike Price. Try and get the Neutral Deltas. Wait for an event. Buy 4-6 months of time. Enter 1 month prior to the event. Exit by noon of the next business day after the event.
Definition of the Short Straddle: Selling Calls and Puts on the Same Strike. This is for a stock that is flat or within a range.
VOLATILITY:
Talked about Historical and Implied Volatility. Talked about the Call Option and how we want the HV and IV to be below the Mid-Point of the Volatility Chart of the underlying stock.
NOTE: Substitute Instructor for December 23rd.
END SESSION --
12/09/2009 -
REVIEW S&P 500 $SPX
Michael - AAPL - Bull Put Spread. 190-195
Jane - RTN - Pivot and Bull Retracement. Watch the
increasing volume. Watch for confirmation
Michael - FSLR - Bull Put Spread
115-120
Joshua - BPS on AAPL and GS
Andrew - BK - Bear Call Spread. bot 32.50 and sold 25. Jan.
Ross - Bear Call Spread TNA. bot 44 call and sold 43 call. Dec.
----
Bull Put Spread
PPT on BPS. Went to example.
END SESSION.
12/02/09 -
Market: SPX developing a symmetrical triangle. Doji next to resistance - kiss goodbye.
V-Trades:
Kevin: CVC - Call Option
Eric: GOOG - Dec 590 Call
Duane: CLF - Stock Trade
Brett/Ursula: CBE - Call Jan $40c
Joshua: GLD - Jan 155c $4.10 up to $6.40
Sector information can be found at:
www.yahoo.com/finance click on investing then stocks
sector info http://biz.yahoo.com/p/s_conameu.html, or http://www.smartmoney.com/sectortracker/
www.moneycentral.msn.com/investor
Put Option Discussion. Strategy Overview, Trade Profile, SUCCESS Model, Example.
END SESSION.
11/18/09 -
Market
V-Trades: SLM Jane
Touched on Naked Calls and Naked Puts
END SESSION
11/11/09 -
Assessed the Broad Market. Will wait to see if the $SPX breaks above resistance at around 1100 to make decision on market direction.
**You cannot plow a straight line looking back.** If you are done with a trade, then be done with it! Don't trade emotionally.
Client Virtual Trading:
Kevin: UPS
Duane: AHT
Michael: MELI
Call Option Training
Summary and S.U.C.C.E.S.S. Model.
Will continue next week.
END SESSION.
11/04/09 -
Looked at the overall Broad Market. $SPX looks to be bearish. We need to wait for confirmation.
Discussion on the $VIX. VIX markets are at or below 20 is considered a time for people to exit their long positions. At 40 or higher is a time to watch for buying opportunities.
Customer trades:
SBUX: Looked for 3G Lights up in Seeker.
INTC: Potential issues with lawsuit.
http://blogs.wsj.com/law/2009/11/04/making-sense-of-the-cuomos-big-antitrust-suit-against-intel/
Learning Skills:
Keep placing virtual trades. Do another Covered Call if the market goes flat or moderately bullish.
END SESSION
10/28/09 -
Discussion on Broad Market Analysis.
$SPY - In a Bullish Retracement, but is moving over the 50MA. Need to watch over the next day or two to see if this will confirm. $SPY is still within +- 1 ATR of the 50 MA.
-Discussed choosing the strategy that the trader "likes" the most. Build upon that. Don't try and eat the elephant all at once. Do the Broad Market Analysis and then use EduTrader to pick the stocks that are leaning towards your particular strategy. Check the sector. Try to get all three lined up if possible.
Started example of a Protected Covered Write. NOT a bearish strategy, but a protective strategy on a stock that you should see go flat or moderately bullish.
- Discussed the adjustment of rolling down and out. Exit the initial call and then sell the next lower strike price call that is one month further out in time.
END SESSION
10/21/09
HSY Looked at both an OTM and ITM Call to sell. If we sell an ITM call , this is known as a Protected Covered Write strategy. The stock was $40.67 and we looked at the $45 call. It only paid $0.25/share. Then we looked at the $40. call which paid
$1.60/share. If we were assigned then we would have a net profit of $0.93.
We discussed an adjustment strategy of Rolling Up and Out. If we owned the stock and the stock was mildly bullish and we wanted to retain the stock, then close to expiration we exit out of our current Call Option position and then we go out another month and sell the next strike price higher.
END SESSION.
Int. Trading Lab
10/14/09
EduTrader Notes:
When using an EduTrader file, put the file into the directory "Edutrader user files." This is found under "documents"
if you are using Vista or "My Documents" under Windows XP. Then open the file from within EduTrader.
-Assessed the Broad Markets.
-Dow topped 10k Last time was 2008
-Will watch for confirmation over the next couple of days to see if the broad markets now use 10k as a level of support.
-Introduced Covered Call strategy.
-Basic rules:
-Stock that is flat or moderately bullish.
-Trading 500k or better on a daily basis
-Stock over $5 and under $50
-Used TradeSeeker and scanned for "Three Green Lights Up" stocks. Found for example PSSI.
-Stock $22.27
-Sell Nov09 22.50 Call for $0.65.
-Learning Skills
-Set up a virtual trader
-Seek for a Covered Call trade.
-Place the trade virtually and be prepared to report at the next lab what you did and why.
---END SESSION---


